No Data Available in Google Analytics 4? Here’s How to Fix It
Last Update: June 22, 2026
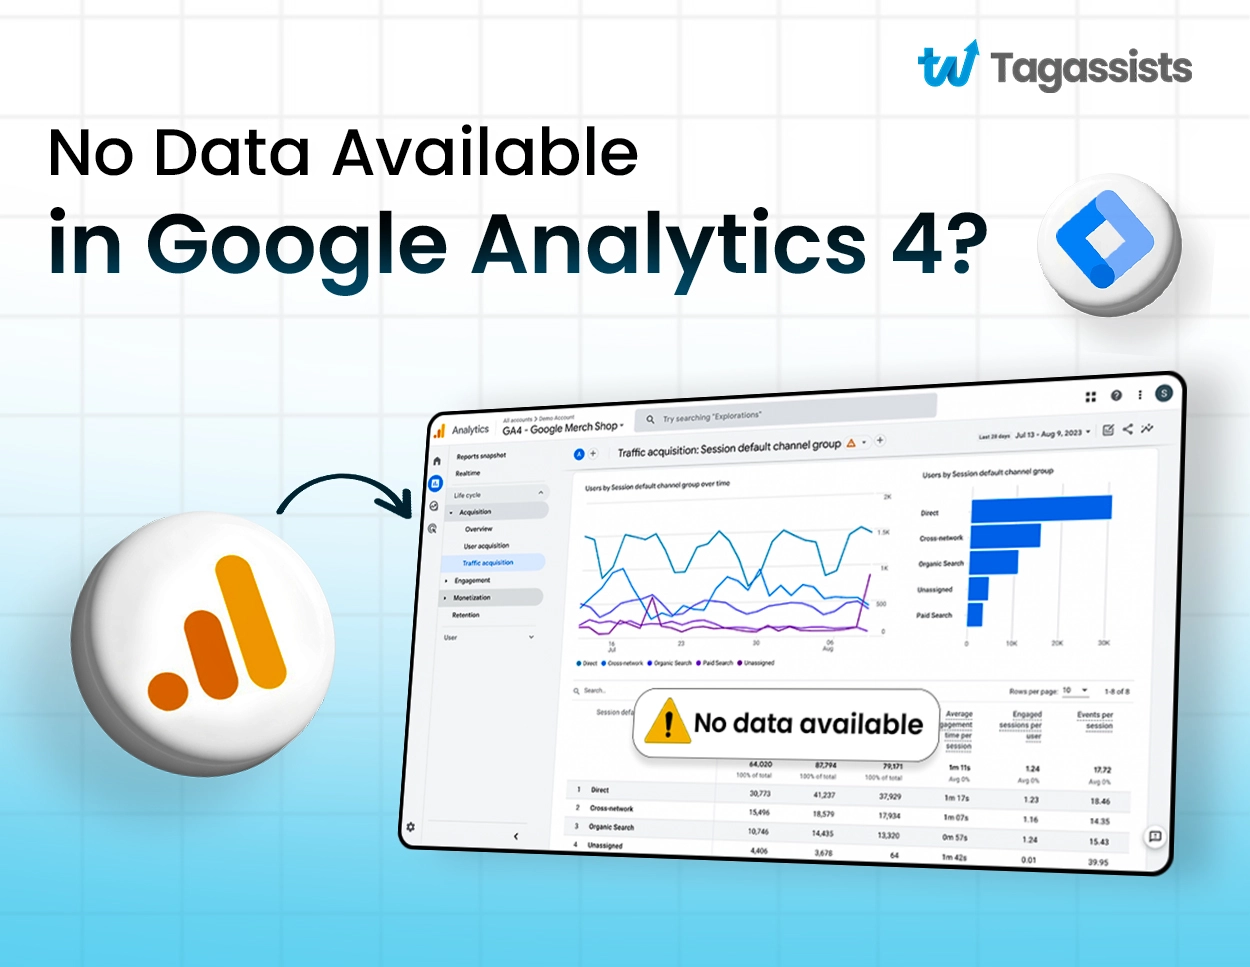
If your reports are completely empty, your tracking code is not firing correctly, your GTM container is not published, or you are looking at the wrong property or data stream. If you see “(data not available)” inside an otherwise working report, wait 24 to 48 hours. In 80 percent of cases, this resolves on its own. If it persists after 48 hours, check your User ID configuration and Consent Mode setup.
But the other 20 percent need real troubleshooting, and if you know which problem you actually have can show you the fastest way to solve it.
At Tagassists, we see both of these problems regularly, often in the same account. It’s frustrating for the clients, specifically because the symptoms look similar, but the causes and fixes are completely different, and we know how to do it.
Today, we will show you how to identify whether you’re dealing with missing data or delayed data, how to diagnose the most common GA4 tracking and configuration problems, and the exact troubleshooting steps to resolve them. We also cover the June 15, 2026, Consent Mode update that is causing silent data loss for many advertisers right now, and why running a manual BigQuery backfill after June 1st, 2026, can actively destroy your existing data.
Key Takeaways:
- “No data available” (empty reports) and “(data not available)” (label in reports) are two different problems requiring different fixes.
- 80 percent of “(data not available)” cases resolve on their own within 24 to 48 hours due to processing delays.
- The June 15, 2026 Consent Mode update made ad_storage the sole control for Google Ads data. If you haven’t updated, you may already be losing attribution data.
- A misconfigured User ID that sends the string “none”, “null”, or “undefined” causes GA4 to treat all visitors as a single user, breaking dimension data entirely.
- Filters in GA4 cause permanent, unrecoverable data loss if activated without testing first.
Why GA4 Says "No Data Available"
There are two different reasons that look similar but need completely different responses. You need to understand first which one you have before you start changing settings. It will save you hours of unnecessary troubleshooting.
- The first reason is empty reports. You open GA4 and see no data at all. No sessions, no users, no events. The Real-Time report shows zero. This means GA4 is not receiving any data from your website. Something in the tracking setup is broken or missing.
- The second scenario is the “(data not available)” label. Your reports have data in them. You can see sessions, users, and events. But in dimensions like Session default channel group, Session source, or First user source, some rows show the label “(data not available)” instead of a recognizable channel name. This means GA4 received the data but hasn’t finished processing it yet. Or there is a configuration issue with how the data is being attributed.
How to Quickly Identify Which Problem You Have
To quickly identify which problem you have check your Real-Time report first.
Go to Reports > Real-Time.
If you see zero active users and you are browsing the site yourself, your tracking is broken. This is the first reason we talked about. If this is happening across your reports, first understand clearly why Google Analytics shows zero visitors in more detail. If Real-Time shows visitors but your standard reports show “(data not available)” in source columns, that’s the second reason.
Symptom | Scenario | What It Means | First Step |
All reports completely empty | Empty Reports | GA4 is not receiving any data | Check tag installation |
Real-Time shows zero | Empty Reports | Tracking code not firing | Use GTM Preview or DebugView |
Reports have data, rows show (data not available) | (Data Not Available) Label | Data received, attribution pending | Wait 24 to 48 hours |
(data not available) persists after 48 hours | (Data Not Available) Label | Configuration issue | Check User ID and Consent Mode |
Data dropped suddenly after a change | Either | Filter, tag, or consent issue | Review recent changes |
Real-Time works but standard reports empty | Processing Delay | Normal GA4 behaviour | Wait 24 to 48 hours |
What "(Data Not Available)" Means in GA4
The “(data not available)” label appeared in GA4 in late March 2025. It replaced what was previously shown as an empty or blank row. Google changed the label to make it clearer that data was received but not yet processed, not that data was missing from the implementation.
“Data not available” does not mean your data is gone. It means it’s still being processed. The data that matters is almost always still there.
When you see “(data not available)” in a traffic source dimension, it means GA4 has received the hit from your website but hasn’t yet completed attribution processing. The system knows a session happened. It just hasn’t finished working out where that session came from, which channel group to assign it to, or how to attribute it in the context of your reporting model. As new referral sources become more common, including AI tools and assistants, it is also worth understanding how AI traffic appears in Google Analytics 4.
This is most common in dimensions related to traffic sources and attribution: Session default channel group, First user medium, Session source / medium, and similar fields. These dimensions need additional processing that takes longer than basic session data. If campaign traffic is being grouped incorrectly or showing unexpected source values, it may also be worth checking whether your UTM parameters are not working in Google Analytics 4.
Label | What It Means | Can You Fix It? | What to Do |
(data not available) | Data received but attribution not yet processed | Usually no. Wait for processing. | Wait 24 to 48 hours then re-check |
(not set) | GA4 never received this value at all | Yes. Fix tags, consent, or User ID. | Check tagging setup and trigger configuration |
(none) | The session had no traffic source parameter | Depends. Maybe direct traffic or missing UTMs. | Audit UTM tagging on campaigns |
Unassigned | Data present, but no channel rule matched | Yes. Update channel group rules. | Check the Default Channel Group configuration |
Why You're Seeing "(Data Not Available)"
Most cases of “(data not available)” come down to one of four causes. It’s either Attribution Processing Delays, User ID Configuration Issues, Recent Property or Stream Changes, or Google Processing Failures.
Attribution Processing Delays
This is the most common cause and accounts for roughly 80 percent of cases.
When a session happens, GA4 records the hit immediately. But attribution data (which campaign this session came from, which source, which medium, which default channel group it belongs to) is processed in a second pass. That pass takes time, 24 to 48 hours for standard reports.
Real-Time reports use instant data and don’t apply full attribution, which is why they can show active sessions while standard reports still show “(data not available)” for those same sessions. This is normal behaviour, not a bug.
User ID Configuration Issues
This is the most dangerous cause because it looks like a temporary issue but it’s actually a tracking bug that compounds over time.
If your GA4 implementation sends a User ID to GA4 even when the user is not logged in, and the value sent is a placeholder string like “none”, “null”, or “undefined”, GA4 treats all of those sessions as belonging to the same user.
Picture what this looks like at scale. You have 1,000 visitors this week. 800 of them aren’t logged in. Your implementation sends the string “none” as the User ID for all 800 anonymous visitors. GA4 now believes 800 different sessions belong to a single user. When it tries to process attribution for that user, the dimension retrieval fails because the data doesn’t make logical sense. The result is “(data not available)” across all of those rows.
Implementation | What Happens | Fix |
gtag(‘set’, ‘user_id’, ‘none’) | GA4 treats all anonymous sessions as one user. Attribution breaks. | Never send User ID for non-logged-in users. Omit the parameter entirely. |
gtag(‘set’, ‘user_id’, ‘undefined’) | Same problem. String ‘undefined’ is treated as a real ID. | Add a conditional check. Only send User ID after confirmed login. |
gtag(‘set’, ‘user_id’, user.id) when user is logged in | Correct. GA4 gets a real, unique identifier. | This is the right approach. Keep this pattern. |
Recent Property or Stream Changes
If you recently migrated from Universal Analytics, created a new GA4 property, changed your data stream configuration, or updated filters, you may see “(data not available)”. This is because GA4 is reprocessing events against your new settings. This resolves within 48 hours but can take longer for large properties.
Google Processing Failures
In rare cases, Google’s own systems experience processing failures that cause data to sit in a pending state longer than usual. These are uncommon but do happen. If you have confirmed your setup is correct and the label persists beyond 72 hours, check the Google Analytics Status Dashboard for any reported incidents.
Is Your Data Still Processing?
Before you change anything in your GA4 setup, confirm whether you’re actually looking at a processing delay rather than a genuine tracking problem. If you make changes while data is still processing can create confusion about whether your fix worked or whether the data just needed more time.
How GA4 Processes Data
GA4 operates in two reporting modes. Real-Time reports show data within seconds of a session starting. Standard reports apply full processing including attribution modeling, channel grouping, and user identity resolution.
Standard reports the ones under Reports > Acquisition, Engagement, Monetisation.
This processing typically takes 24 to 48 hours but can occasionally take longer.
How to Use DebugView to Confirm Data is Arriving
DebugView is the fastest way to confirm your GA4 property is actually receiving data.
Go to Admin > DebugView.
Open your website in a browser with the GA4 DebugView enabled (either through the Google Analytics Debugger Chrome extension or by appending ?debug_mode=1 to your URL). You should see events appear in DebugView in real time as you interact with the site.
If events appear in DebugView but not in standard reports, your tracking is working correctly. You just need to wait for processing. If nothing appears in DebugView at all, your tracking is broken, and you need to diagnose the tag setup.
What You See | What It Means | What to Do |
Events in DebugView, (data not available) in reports | Tracking works. Processing pending. | Wait 24 to 48 hours. Don’t change anything. |
Nothing in DebugView, nothing in Real-Time | Tag is not firing at all. | Move to tag installation diagnosis. |
Events in DebugView, zero in Real-Time | DebugView session, data not streaming to reports | Confirm debug mode is disabled for production testing. |
Real-Time shows data but standard reports empty or delayed | Normal processing delay for new setup | Wait 24 to 48 hours for standard reports to populate. |
When to Wait vs When to Start Troubleshooting
- Wait if: your GA4 property was just set up or just migrated.
- Wait if: you see data in Real-Time or DebugView.
- Wait if: “(data not available)” appears in source dimensions but session counts look correct.
- Troubleshoot if: Real-Time shows zero active users when you’re on the site.
- Troubleshoot if: no events appear in DebugView after 15 minutes of browsing.
- Troubleshoot if: “(data not available)” persists in all dimensions after 48 hours.
GA4 Reports Are Empty: What to Check First?
If your reports are completely empty and DebugView shows nothing, your tracking setup has a problem. Work through these checks in order. Most empty report issues come from one of five causes. If your events are firing but still not appearing in standard reports, our guide on GA4 events not showing up in reports covers that specific issue in more detail.
Verify the GA4 Tag Is Actually on Your Pages
The most common cause of empty GA4 reports is that the tracking code isn’t on the website. This happens more often than it sounds. A developer updates a theme or rebuilds a page template and removes the GA4 snippet in the process. Or the tag was added to one page template, but not all of them.
How to check:
- Open your website in Chrome.
- Right-click and select View Page Source.
- Search for your Measurement ID (it starts with G- followed by numbers).
If you don’t find it, the tag is missing from that page. Repeat this on multiple page types, especially page templates that were recently updated.
Test Real-Time Reports While Browsing
Open your website in an incognito window (to avoid any internal traffic filters).
Then go to GA4 and check Reports > Real-Time.
You should appear as an active user within 30 seconds. If you don’t, the tag is not firing for that session.
Review Google Tag Manager Setup
If you’re using GTM to deploy GA4, there are two common mistakes that cause empty reports. First, the GTM container is in draft mode and has never been published. Changes you make inside GTM don’t go live until you click Submit and publish the container. Second, the GA4 configuration tag exists but has no trigger, or the trigger is misconfigured.
How to check:
- In GTM, go to your workspace.
- Click Preview.
- Navigate your website.
The GTM Debug panel shows every tag and whether it fired. Look for your GA4 Configuration tag. If it’s not in the “Tags Fired” column, check the trigger. If the issue is related to lead submissions, you should also confirm that your forms are being tracked correctly in GA4 using GTM.
Check for Duplicate GA4 Tags
After migrations and website rebuilds, duplicate tags are a common problem. If your site has the GA4 snippet hardcoded in the page header AND a separate GA4 tag firing through GTM, you end up with two instances sending data. This can cause inflated session counts, attribution issues, and duplicate events in Google Analytics 4.
How to check:
- Use the Google Tag Assistant Chrome extension.
- Navigate your site and look for multiple instances of the same Measurement ID in the tag report.
- If you see the same G- ID firing more than once per page, remove the duplicate.
Verify the Measurement ID
A mismatch between the Measurement ID in your tag and the GA4 property you’re looking at is more common than you’d think. Every GA4 property and data stream has its own G- Measurement ID. If you copied the wrong one, the data is going somewhere, but not where you’re looking.
How to check:
- In GA4, go to Admin > Data Streams > select your stream.
- Copy the Measurement ID shown there.
- Then check that exact ID appears in your GTM tag or hardcoded snippet.
Filters, Ad Blockers, and Settings That Can Hide Your Data
Even when your GA4 tag is installed correctly and firing on every page, you can still see empty or incomplete reports if something upstream is blocking or filtering the data.
Internal Traffic Filters
GA4 lets you create filters that exclude traffic from specific IP addresses, typically to exclude your own team’s browsing from the data. If this filter is too broad or misconfigured, it can block legitimate visitor data.
How to check:
- Go to Admin > Data Filters.
- Look for any active filters.
- Temporarily set them to “Inactive” mode and check whether data starts appearing.
- If it does, the filter is the problem.
- Narrow the IP range before reactivating it.
Note: Test Filters Before Activating
GA4 data filters cause permanent, unrecoverable data loss if misconfigured. Once a filter is active and blocking data, those sessions are gone. Always create a new filter in “Testing” mode first, verify it behaves correctly over 24 hours, then switch to “Active”. Never skip the testing step.
Ad Blockers and Browser Privacy Tools
Ad blockers, privacy-focused browsers like Brave, and browser extensions like uBlock Origin actively block GA4 tags from firing. This is important to know for two reasons. First, if you’re testing your own tracking while using an ad blocker, your tests will fail even if your setup is correct. Always test in an incognito window with extensions disabled.
Second, a meaningful percentage of your real visitors will also be using ad blockers. This isn’t something you can fully fix within standard GA4, but server-side tracking through GTM server-side containers significantly reduces the impact because the data request comes from your own server rather than from the visitor’s browser.
Consent Mode Configuration (Important for 2026)
This is the most important configuration issue to understand in 2026. Google Consent Mode has two modes:
- Basic
- Advanced
The mode you’re using determines how much data GA4 captures when visitors decline cookies.
Countries with high consent rejection rates include Germany (50 percent-plus), France (35 to 45 percent), and Italy (25 to 35 percent). If you’re running Basic Mode for EU traffic, you’re losing reporting accuracy for a large portion of your visitors.
Consent Mode | What Happens When User Declines | Data Impact | Recommendation |
Basic Mode | All tags are blocked completely. No data sent to GA4. | Permanent data loss for declining users. No modeled conversions. | Not recommended for performance-driven sites. |
Advanced Mode | Tags load but send cookieless anonymous pings. No cookies set. | Enables conversion modeling. Recovers more than 70% of lost attribution. | Recommended for most sites running Google Ads. |
No Consent Mode | Tags fire regardless of consent. Non-compliant in EU/EEA. | Appears complete but violates privacy regulations. | Must implement Consent Mode if serving EU/EEA users. |
The June 15, 2026 Consent Mode Change
2026 Update: Google Signals No Longer Controls Ad Data
Starting June 15, 2026, Google Signals no longer governs advertising data in linked GA4 and Google Ads accounts. The ad_storage consent parameter is now the sole control for whether advertising data flows between GA4 and Google Ads.
If your Consent Mode v2 implementation does not explicitly set ad_storage, you will see permanent attribution data loss for Google Ads campaigns. This affects conversion tracking, remarketing audiences, and Smart Bidding data.
Check Admin > Data Settings > Data Collection to verify your Google Signals and Consent Mode status immediately.
The correct Consent Mode v2 implementation needs four parameters. Here is the code pattern:
Parameter | Controls | Default (Before Consent) | Why It Matters Post June 15, 2026 |
ad_storage | Advertising cookies and GA4-to-Ads data flow | denied | Now the sole control for Google Ads attribution. Critical. |
analytics_storage | GA4 analytics cookies | denied | Controls GA4 data collection for analytics reports. |
ad_user_data | Consent to send ad data to Google | denied | Required for Google Ads features under DMA. |
ad_personalization | Personalized ads and remarketing | denied | Required for remarketing audiences to populate. |
Server-Side Tracking Considerations
Traditional GA4 tracking relies on a visitor’s browser, which means ad blockers, browser privacy settings, and consent restrictions can prevent data from being collected. Server-side tracking through GTM’s server-side container sends data from your server to Google rather than from the visitor’s browser. This reduces ad blocker impact and improves data accuracy. You get more control over what data is collected and transmitted.
If you’re seeing significant unexplained gaps in GA4 data and you’ve confirmed your tag setup is correct, server-side tracking is often the next step worth investigating.
Common GA4 Setup and Migration Problems
Many GA4 data issues are caused by setup or migration mistakes rather than problems with your current tracking. The tricky part is that these issues often stay hidden until you start auditing your data.
Universal Analytics Migration Issues
Many GA4 properties were created during the forced migration from Universal Analytics in 2023. Some of those migrations used Google’s automatic upgrade flow. This setup created a GA4 property but didn’t always configure it correctly. If your GA4 property was auto-created and you’ve had persistent data quality issues since, now you should create a fresh property and setting it up properly from scratch.
Duplicate Properties
It’s common for businesses to have multiple GA4 properties created at different times by different people. The main website might have two or three GA4 properties attached to it, with different teams looking at different ones. This creates data discrepancies that are hard to diagnose without auditing the full account structure.
How to check: In GA4, go to Admin and look at the Account column. If you see multiple properties for the same domain, that’s a problem. Consolidate to one property and ensure all tags point to the same Measurement ID.
Wrong Data Stream Selected
A GA4 property can have multiple data streams: one for your website, one for your iOS app, one for your Android app. If you’re looking at the website data stream while your tag is sending data to the mobile app stream (or vice versa), you’ll see nothing in the reports you’re checking even though data is being collected.
How to check: Go to Admin > Data Streams. Note which streams exist and which Measurement IDs they use. Then verify your tag is sending to the correct stream ID for the platform you’re diagnosing.
Access and Permission Issues
If you were recently added to a GA4 account, your role determines what you can see. A Viewer can access reports but can’t see admin settings. A Marketer can create audiences but can’t change data settings. If reports appear empty and everything else looks correct, verify your access level under Admin > Account Access Management.
Orphaned Properties
An orphaned GA4 property is one where the original admin account has been deleted or lost access, leaving the property with no owner. If you’re working on a property inherited from a previous team or agency, check that there is at least one active admin account with full control. Without this, you may not be able to make configuration changes even when you can see the reports.
Important 2026 Technical Bugs That Cause Silent Data Loss in GA4
In 2026, four technical issues are behind many of the GA4 data problems we investigate: SPA and PWA tracking bugs, Content Security Policy (CSP) restrictions, GA4 payload size limits, and Exploration sampling.
All of them cause data loss silently, with no error message in GA4 to tell you that something is wrong.
SPA and PWA Sites: The dataLayer.push Bug
If your website is a Single Page Application (React, Vue, Angular) or a Progressive Web App, there is a specific bug that causes GA4 to receive data on the first page load only and then stop tracking for the rest of the session.
The bug: Some implementations use dataLayer = [ ] to initialise the data layer. For a standard multi-page website this works because the page reloads with each navigation and dataLayer gets reset. For SPAs and PWAs, the page never reloads. The dataLayer gets set once on initialisation and never updated again when users navigate between views.
You must use dataLayer.push() instead. This adds events to the existing array rather than replacing it, which is what GTM reads.
Implementation | What Happens on SPA Navigation | Fix |
dataLayer = [{‘event’: ‘page_view’}] | Fires once on load. No tracking on navigation. Silent failure. | Replace with dataLayer.push() |
dataLayer.push({‘event’: ‘page_view’, ‘page_path’: window.location.pathname}) | Fires on every navigation event. Correct behaviour. | This is the correct approach. |
Content Security Policy Blocking GTM Silently
A Content Security Policy (CSP) is a security header that controls which external scripts your browser is allowed to load. If your CSP doesn’t include Google Tag Manager’s domains, GTM is blocked silently. No error appears in GA4. No data is collected. The only sign is in the browser’s developer console, where you’ll see a CSP violation error.
How to check:
Open Chrome DevTools (F12) > Console. Look for “Content Security Policy” errors mentioning googletagmanager.com or google-analytics.com. If you see them, your CSP needs updating.
The CSP header needs to allow: www.googletagmanager.com for the script source, www.google-analytics.com for the connection source, and both domains for image sources used in GA4’s measurement protocol pings.
GA4 Payload Size Limit (16K Per Request)
GA4 has a maximum payload size of 16,384 bytes per request. If a single hit exceeds this limit, the entire transmission fails, and GA4 receives nothing from that event. This is a doubling of Universal Analytics’ 8K limit. So you’re unlikely to hit it with standard tracking. But e-commerce implementations with large product arrays, extensive custom parameters, or very long user ID strings can exceed it.
If you suspect this is happening, check your e-commerce events in GTM Preview mode. Look at the data layer payload size for purchase events specifically. If individual events carry more than 15 items in the items array with long descriptions and custom parameters, you may be approaching the limit.
Sampling Quotas in GA4 Explorations
Standard GA4 properties apply sampling when your Exploration report query involves more than 10 million events. The data doesn’t disappear, but what you see in the report is an extrapolation from a sample rather than exact counts. GA360 properties have access to unsampled Explorations up to 1 billion events, with a daily token allowance of 20,000 tokens and a maximum of 5,000 tokens per query.
If your Exploration results look incomplete or inconsistent, reduce the date range or add more specific filters to bring the event count below the sampling threshold.
The June 1, 2026 Data Retention Change You Need to Know About
Warning: Manual BigQuery Backfill After June 1, 2026 Will Destroy Your Data
Starting June 1, 2026, Google Ads data older than 37 months is deleted at the hourly, daily, and weekly levels. Monthly, quarterly, and annual data are still available for 11 years.
But here is the trap: if you run a manual BigQuery backfill for dates beyond 37 months after June 1, 2026, you will actively overwrite your existing data with empty values. The backfill process replaces whatever was stored with blank records for those dates. Do not run manual backfills for any date period older than 37 months.
If you need historical data beyond 37 months, export it before the deletion date. Monthly aggregates are still preserved, so for trend reporting you can use monthly granularity for older periods. The practical impact is on anyone doing detailed day-level attribution analysis going back more than three years.
Quick Checklist to Find the Problem
Work through this checklist in order. Each step takes two to five minutes. Most GA4 data problems are identified within the first four steps.
Step | Check | Where | What to Look For |
1 | Check Real-Time report while browsing site in incognito | Reports > Real-Time | You should appear as an active user within 30 seconds |
2 | Check DebugView with GA4 Debugger extension active | Admin > DebugView | Events should appear as you interact with the site |
3 | Wait 24 to 48 hours if setup is recent | Standard reports | “(data not available)” in source dimensions should resolve |
4 | Verify tag installation on multiple page types | View Page Source or Tag Assistant | Your G- Measurement ID should appear on every page |
5 | Review GTM: is the container published? | GTM > Submit button | Version published date should match recent changes |
6 | Confirm Measurement ID matches GA4 property | GA4 Admin > Data Streams vs GTM tag | Exact G- ID match between property and tag |
7 | Review active Data Filters | Admin > Data Filters | No filters set to Active that could block your traffic |
8 | Check Consent Mode configuration | GTM > Consent Mode tag | All four parameters present. Advanced Mode if running Google Ads. |
9 | Confirm correct data stream selected | Admin > Data Streams | Web stream ID matches your website tag |
10 | Check for duplicate GA4 tags | Tag Assistant or GTM Preview | Same Measurement ID should fire only once per page |
When to Troubleshoot Yourself vs Get a GA4 Audit
Most single-cause GA4 data problems are fixable with the checklist above. But some situations call for a more systematic review of the entire implementation rather than chasing individual issues.
Situations Where Manual Troubleshooting Is Enough
- You set up GA4 recently, and reports are empty. Follow the checklist above.
- You see “(data not available)” in source dimensions. Wait 24 to 48 hours first.
- You made a recent change (new filter, GTM update, site migration), and data dropped. Reverse the change and check if the data recovers.
- You need to confirm that Consent Mode is set to Advanced Mode. This is a one-time configuration check.
When Complex Setups Need a Deeper Review
- Your GA4 data doesn’t match what Google Ads reports for the same period. This usually points to Consent Mode misconfiguration, attribution window differences, or conversion counting discrepancies.
- You inherited a GA4 property from a previous agency and don’t know what filters, custom channel groups, or event modifications are active.
- You have a multi-property setup with data streams across web, iOS, and Android and aren’t sure which stream is sending which data.
- Your ecommerce revenue in GA4 doesn’t match your actual order system. This is almost always a tracking implementation problem that needs a systematic audit.
Multi-Property and Agency-Managed Environments
If your GA4 account is managed by an external agency, there is a specific access problem to watch for. Some agencies create GA4 properties under their own Google account rather than under your business account. If the agency relationship ends, you may lose access to your historical data. Make sure your GA4 property lives under your own Google Analytics account and that the agency has been added as a user rather than owning the property.
Mistakes That Make GA4 Data Issues Worse
Many GA4 data issues become harder to diagnose because of avoidable troubleshooting mistakes. Common examples are making multiple changes at once and testing with ad blockers enabled. This means data loss, activating filters without testing them first, running risky BigQuery backfills, overlooking duplicate GA4 tags, and failing to implement Consent Mode correctly.
These mistakes can create new tracking problems, hide the real cause of an issue, or even lead to permanent data loss, making accurate troubleshooting much more difficult.
Mistake 1: Making Multiple Changes at Once
When you change several settings at the same time, it’s impossible to know which one fixed the issue, or which one created a new problem.
What to do instead: Change one thing at a time and wait at least 24 hours before making another adjustment.
Mistake 2: Testing with an Ad Blocker Enabled
Ad blockers can prevent GA4 and GTM from firing correctly, making it look like tracking is broken when it isn’t.
What to do instead: Test in an incognito window with all browser extensions disabled.
Mistake 3: Ignoring Real-Time Reports
Many users assume data isn’t being collected when it’s actually just waiting to be processed.
What to do instead: Check the Real-Time report first. If events are appearing there, give GA4 time to process the data before troubleshooting further.
Mistake 4: Treating “(data not available)” as Data Loss
Seeing “(data not available)” often causes unnecessary panic and configuration changes.
What to do instead: Wait 24 to 48 hours. In most cases, the missing values will populate automatically.
Mistake 5: Activating Filters Without Testing
Incorrect filters can permanently exclude data, and once it’s gone, it can’t be recovered.
What to do instead: Always use Testing mode first and verify the results before publishing filters.
Mistake 6: Running a BigQuery Backfill for Dates Older Than 37 Months
Following the June 2026 changes, backfilling very old data can overwrite existing records with blank values.
What to do instead: Avoid manual backfills for dates older than 37 months after June 1, 2026.
Mistake 7: Overlooking Duplicate Tags
Multiple GA4 tags firing on the same page can inflate sessions, events, and conversions while distorting attribution reports.
What to do instead: Use Tag Assistant to check for duplicate G-IDs before investigating other tracking issues.
Mistake 8: Ignoring Consent Mode for EU and EEA Traffic
Missing or incorrect Consent Mode implementation can create data gaps that look like tracking failures.
What to do instead: Implement Consent Mode v2 Advanced Mode and verify that consent signals are being passed correctly.
How Tagassists Helps Fix GA4 Data Issues
Struggling with GA4
Data Problems?
We identify and fix data issues so you can trust your analytics again.
Most GA4 data problems we find during audits fall into one of three categories: tracking setup problems the client didn’t know existed, Consent Mode configurations that were never updated from Basic to Advanced, and filter or property issues inherited from a previous setup.
Here is what a Tagassists GA4 audit covers:
- Real-Time & DebugView Check: Verify GA4 is receiving data correctly.
- GTM Audit: Review tags, triggers, variables, and publishing status.
- Measurement ID Verification: Confirm data is being sent to the correct property and stream.
- Filter Review: Check filters and IP exclusions for unintended data blocking.
- Consent Mode Audit: Verify Consent Mode v2 is configured correctly.
- Migration Audit: Identify issues caused by Universal Analytics to GA4 migrations.
If you’re not sure whether your GA4 is collecting data correctly, a free audit is the fastest way to find out. We’ll show you exactly what’s visible, what’s broken, and what’s needed to fix it.
Conclusion
“No data available” in GA4 is not one problem. It’s two. Empty reports mean tracking is broken. “(data not available)” in dimension rows usually means data is still processing.
Most GA4 data issues fall into three categories:
1. Processing delays. Wait 24 to 48 hours before diagnosing. Check Real-Time and DebugView to confirm data is arriving.
2. Tracking setup problems. Missing tag, unpublished GTM container, wrong Measurement ID, duplicate tags, or SPA dataLayer.push bug.
3. Filter and configuration issues. Consent Mode in Basic Mode, misconfigured filters, User ID sending placeholder strings, or CSP blocking GTM.
The recommended troubleshooting order: check Real-Time first, use DebugView to confirm data is arriving, wait 24 to 48 hours if setup is recent, verify tag installation, check GTM publication status, confirm Measurement ID, review filters, and check Consent Mode.
In 2026, two changes make this more urgent than it’s been before. The June 15 Consent Mode update means ad_storage is now the sole control for Google Ads attribution data. And the June 1 data retention change means manual BigQuery backfills for old dates will overwrite existing data with blanks. Act on both before they affect your reporting.
Frequently Asked Questions
Why is GA4 showing no data?
Empty GA4 reports most commonly mean the tracking tag is not firing. Check that your GA4 Measurement ID appears in the source code of your pages, that your GTM container has been published (not just saved), and that the correct property and data stream are selected. Use Real-Time reports and DebugView to confirm whether any data is arriving at all.
Why does GA4 show "(data not available)"?
This label means GA4 received the session data but has not yet completed attribution processing. It’s most common in traffic source dimensions like Session default channel group or First user source. In 80 percent of cases it resolves on its own within 24 to 48 hours. If it persists beyond 48 hours, check whether your User ID configuration is sending placeholder values like “none” or “null” for anonymous users.
How long does GA4 take to process data?
Real-Time reports update within seconds. Standard reports typically take 24 to 48 hours to fully process, including attribution data for traffic source dimensions. For very large properties or after major configuration changes, processing can occasionally take up to 72 hours. If no data appears after 72 hours, there is a tracking or configuration problem that needs diagnosing.
Why is Real-Time working but standard reports are empty?
This is normal behaviour for a newly set up GA4 property. Real-Time shows data immediately. Standard reports require 24 to 48 hours of processing before data populates. If your setup is new, wait before troubleshooting. If you’ve been running GA4 for more than a week and standard reports are still empty, check for active Data Filters that may be blocking data from appearing in standard views.
Can Consent Mode stop GA4 tracking?
Yes. If you’re using Basic Mode, all GA4 tags are completely blocked when a visitor declines consent. This means zero data is sent for those visitors. Advanced Mode allows tags to fire in a cookieless mode even after consent denial, enabling GA4 to model behavior from anonymous pings. For any site running Google Ads with EU/EEA traffic, Advanced Mode is strongly recommended to prevent significant data gaps.
How do I verify my GA4 tag?
Use three tools: the Google Tag Assistant Chrome extension shows which tags are firing on each page and whether they have errors, GA4’s DebugView shows events in real time when you browse with debugging enabled, and GTM’s Preview mode shows exactly which tags fired and why for each page interaction. Between these three, you can pinpoint almost any tag firing problem within a few minutes.
Why did GA4 stop tracking after a website redesign?
Website redesigns commonly remove or replace the GA4 tracking code. Developers working on new page templates often don’t check whether existing analytics code carries over. After any redesign, verify that your Measurement ID appears in the source of every page type, that GTM’s snippet is in both the head and body sections if you’re using GTM, and that no new Content Security Policy was added that blocks GTM domains.
Does an ad blocker affect GA4 testing?
Yes, significantly. Ad blockers like uBlock Origin and Brave’s built-in shield block GA4 tags from loading entirely. This means if you test your tracking while an ad blocker is active, you will see zero events in DebugView and Real-Time even when tracking is perfectly set up. Always test in an incognito window with all browser extensions disabled.
What is DebugView in GA4?
DebugView is a real-time event monitor inside GA4 that shows individual events as they fire from a specific device. To use it, install the Google Analytics Debugger Chrome extension, enable debug mode, and then browse your website. Every event appears in DebugView within seconds. It’s the most reliable way to confirm your GA4 tag is working before standard reports have had time to process.
Should I create a new GA4 property to fix data issues?
Only as a last resort. Creating a new property resets all historical data (which cannot be transferred) and requires setting up all custom events, conversions, audiences, and channel groups from scratch. Try all troubleshooting steps first. A new property is only justified if your existing property was auto-migrated from Universal Analytics in a way that introduced unfixable configuration issues, or if the original property has no accessible admin.

Abdullah Al Zahid
Abdullah Al Zahid is the CEO & Founder of tagassists and a media buying specialist with over 4 years of experience. He has managed more than $7.5M in advertising spend, helping businesses grow through effective digital marketing, web analytics, and tracking solutions.